Histogram and density plot
Problem
You want to make a histogram or density plot.
Solution
Some sample data: these two vectors contain 200 data points each:
set.seed(1234)
rating  <- rnorm(200)
head(rating)
#> [1] -1.2070657  0.2774292  1.0844412 -2.3456977  0.4291247  0.5060559

rating2 <- rnorm(200, mean=.8)
head(rating2)
#> [1] 1.2852268 1.4967688 0.9855139 1.5007335 1.1116810 1.5604624
When plotting multiple groups of data, some graphing routines require a data frame with one column for the grouping variable and one for the measure variable.
# Make a column to indicate which group each value is in
cond <- factor( rep(c("A","B"), each=200) )

data <- data.frame(cond, rating = c(rating,rating2))
head(data)
#>   cond     rating
#> 1    A -1.2070657
#> 2    A  0.2774292
#> 3    A  1.0844412
#> 4    A -2.3456977
#> 5    A  0.4291247
#> 6    A  0.5060559
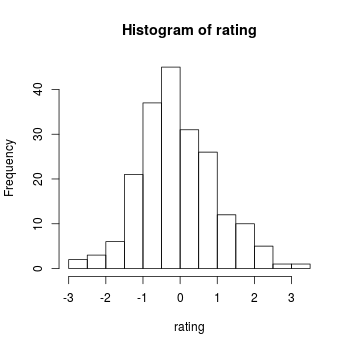
# Histogram
hist(rating)
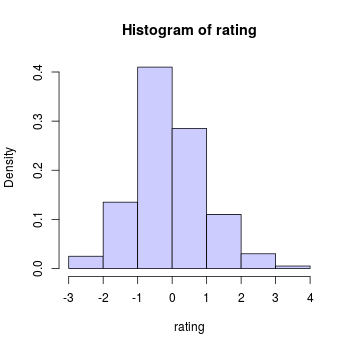
# Use 8 bins (this is only approximate - it places boundaries on nice round numbers)
# Make it light blue #CCCCFF
# Instead of showing count, make area sum to 1, (freq=FALSE)
hist(rating, breaks=8, col="#CCCCFF", freq=FALSE)
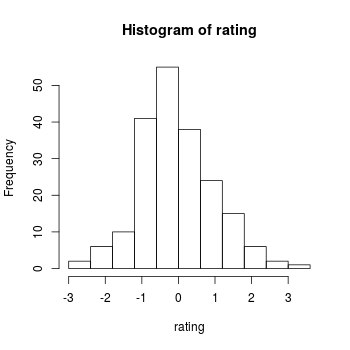
# Put breaks at every 0.6
boundaries <- seq(-3, 3.6, by=.6)
boundaries
#> [1] -3.0 -2.4 -1.8 -1.2 -0.6 0.0 0.6 1.2 1.8 2.4 3.0 3.6
hist(rating, breaks=boundaries)
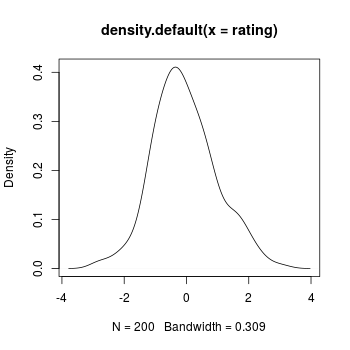
# Kernel density plot
plot(density(rating))
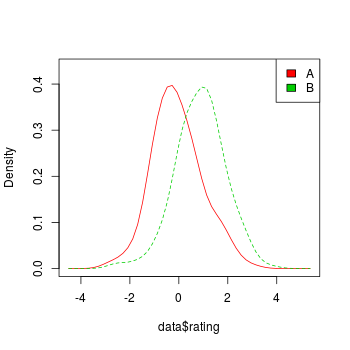
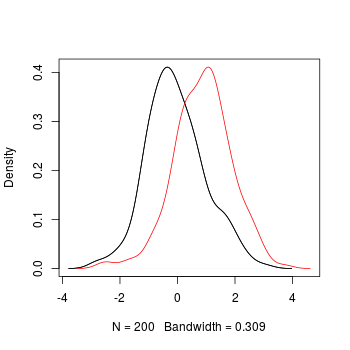
Multiple groups with kernel density plots.
This code is from: http://onertipaday.blogspot.com/2007/09/plotting-two-or-more-overlapping.html
plot.multi.dens <- function(s)
{
    junk.x = NULL
    junk.y = NULL
    for(i in 1:length(s)) {
        junk.x = c(junk.x, density(s[[i]])$x)
        junk.y = c(junk.y, density(s[[i]])$y)
    }
    xr <- range(junk.x)
    yr <- range(junk.y)
    plot(density(s[[1]]), xlim = xr, ylim = yr, main = "")
    for(i in 1:length(s)) {
        lines(density(s[[i]]), xlim = xr, ylim = yr, col = i)
    }
}

# the input of the following function MUST be a numeric list
plot.multi.dens( list(rating, rating2))
The sm package also includes a way of doing multiple density plots. The data must be in a data frame.
library(sm)
sm.density.compare(data$rating, data$cond)
# Add a legend (the color numbers start from 2 and go up)
legend("topright", levels(data$cond), fill=2+(0:nlevels(data$cond)))